

The U.S. and Iran announced a preliminary agreement intended to end the four-month conflict that has weighed on the global economy. Financial markets have reacted positively to this development, with the stock market climbing, oil prices falling, and interest rates declining. How should investors interpret this agreement and what does it mean for portfolios?
The deal, which is described as a "memorandum of understanding," includes the reopening of the Strait of Hormuz, with a final deal to happen over a 60-day period. While the announcement of a deal is encouraging, especially from a humanitarian perspective, there are still many questions remaining that will take weeks to play out. In particular, the full text of the agreement has not been released and disagreements remain over difficult issues such as Iran's nuclear program and sanctions.
For investors, it’s important to remember that there have been many tentative ceasefires and failed negotiations since the war began. These events have driven short-term market swings as investors react to the flow of news. So, while these latest developments are positive, they occur in the context of markets that have been trending in a positive direction and an economy that has remained resilient.
Oil prices and inflation: possible relief at the pump
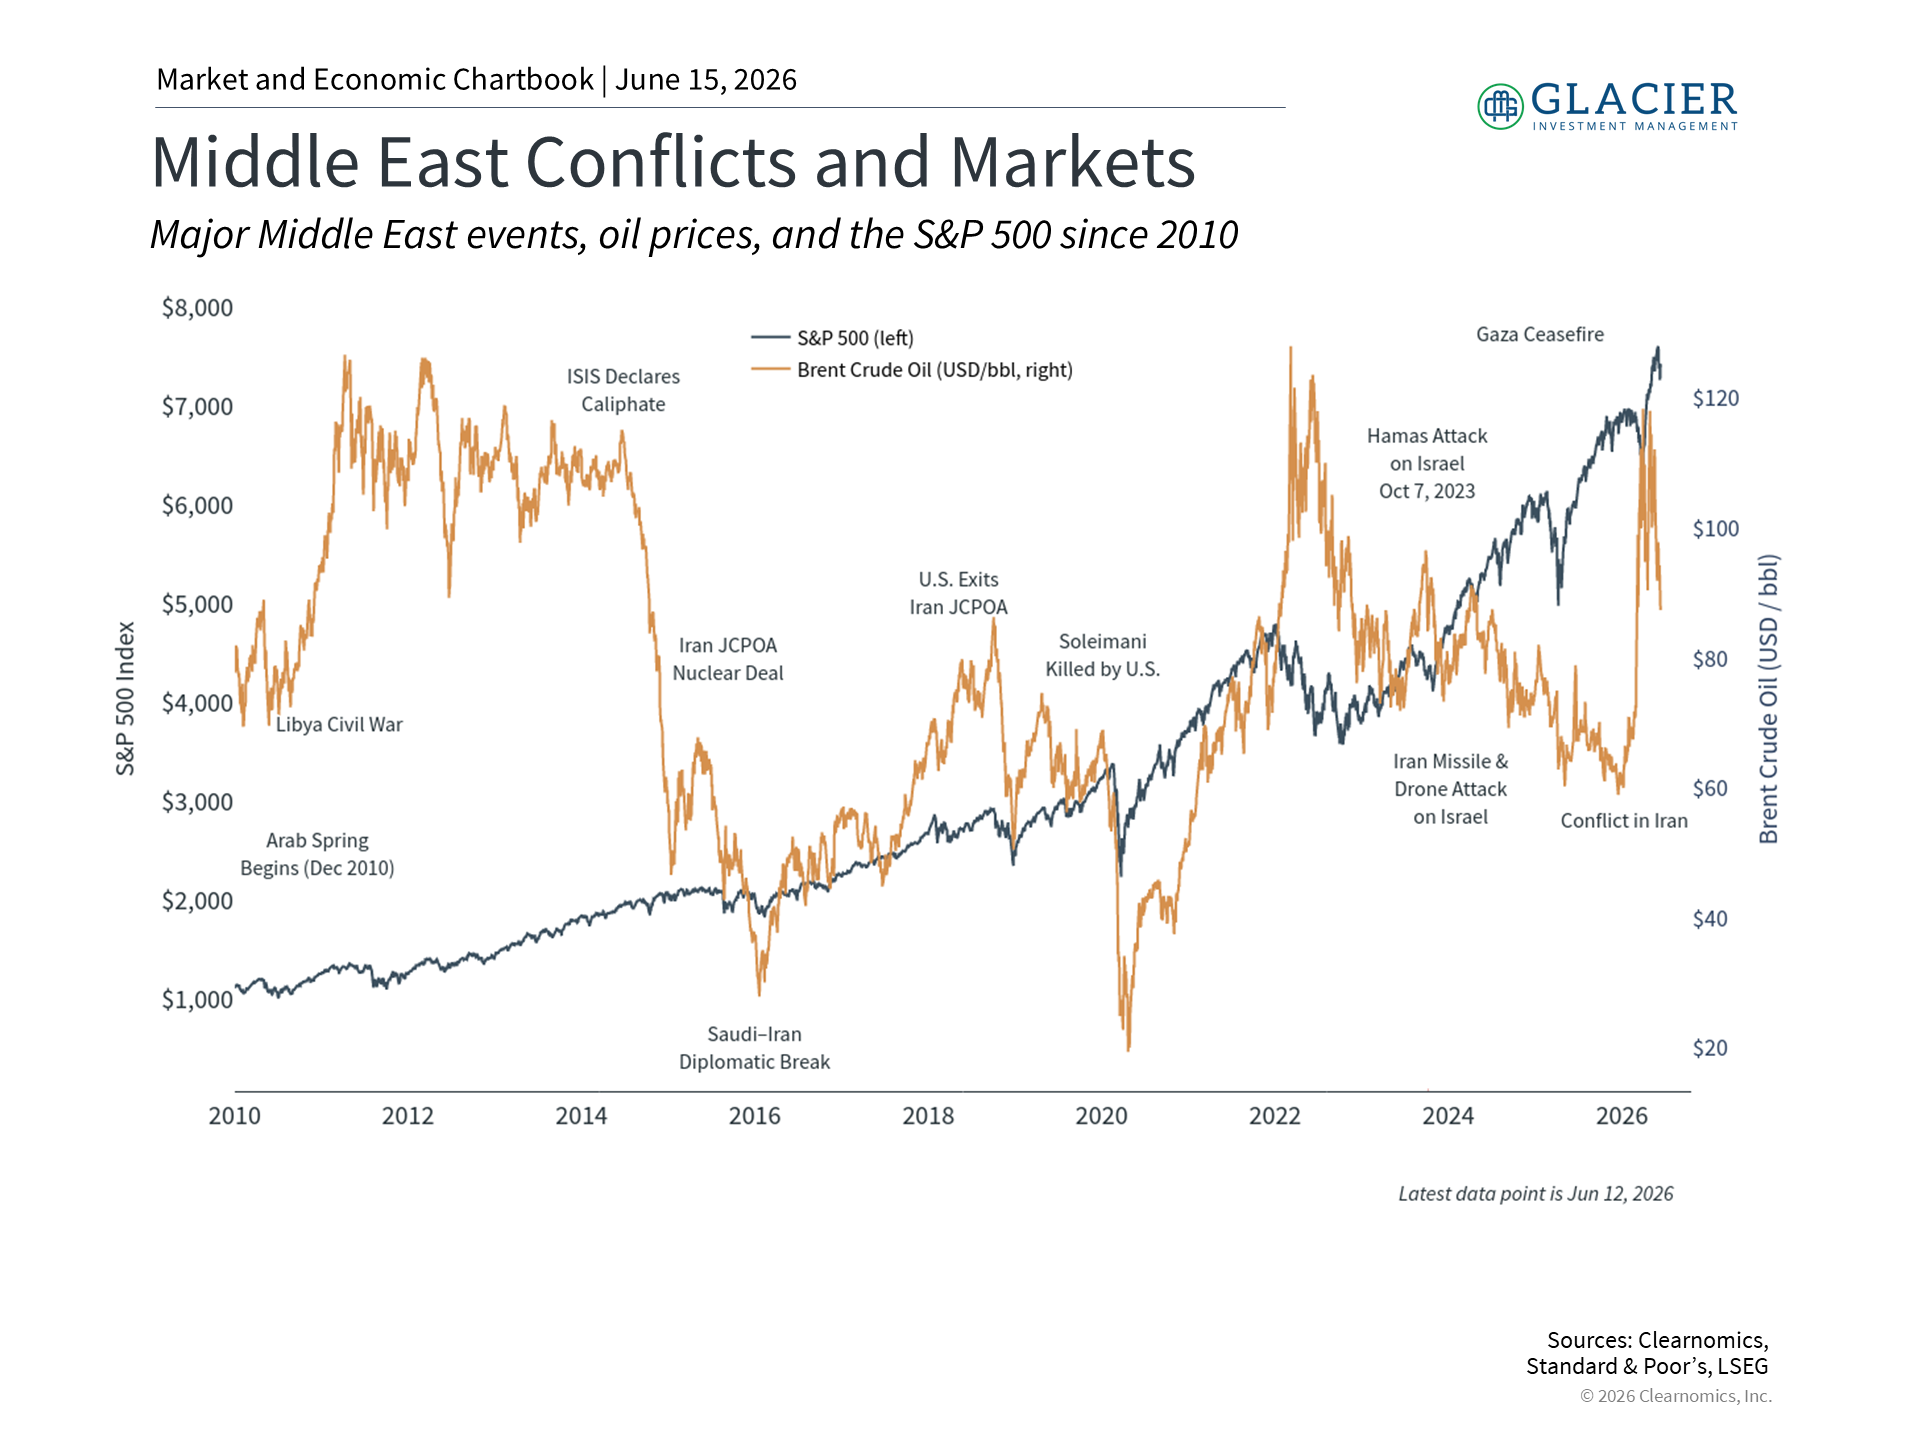
Energy prices are the primary channel through which geopolitical conflicts affect the broader economy. The effective closure of the Strait of Hormuz, a major waterway for oil and gas, forced major Middle Eastern producers to scale back output as storage capacity filled up. However, oil prices had already begun to trend lower in recent weeks, falling more than 25% from the April peak of $118 per barrel to around $85 before the preliminary peace deal was announced.1
History shows that while Middle East conflicts can lead to spikes in oil prices, these events tend to be short-lived. In the long run, what drives oil prices are supply and demand factors such as increased U.S. oil production. This is why economists often describe supply-side shocks as “transitory,” meaning their inflationary effects tend to fade once the underlying disruption is resolved. A reopening of the Strait of Hormuz would be an important step in that direction, even if it does take time for fuel prices to return to more normal levels.
Gasoline prices at the pump have followed a similar trend. The average price of regular unleaded gasoline rose above $4.50 per gallon at its peak in late May before pulling back toward $4.00 per gallon more recently. The latest Consumer Price Index report shows that energy prices have risen 23.5% year over year, with gasoline up 40.5%. This energy spike was the primary driver of headline CPI reaching 4.2% in May, its highest level in several years.2
While this creates challenges for consumers, it has also not proven to be a repeat of the post-pandemic inflationary period. Importantly, core inflation, which excludes food and energy, rose only 2.9% year over year in May. This suggests that higher oil prices have not fully spread broadly across the economy. If oil prices continue to trend lower, the hope is that price pressures will improve as well, which could help the Fed as it manages higher inflation and a strengthening jobs market.
Markets have experienced healthy gains this year across asset classes
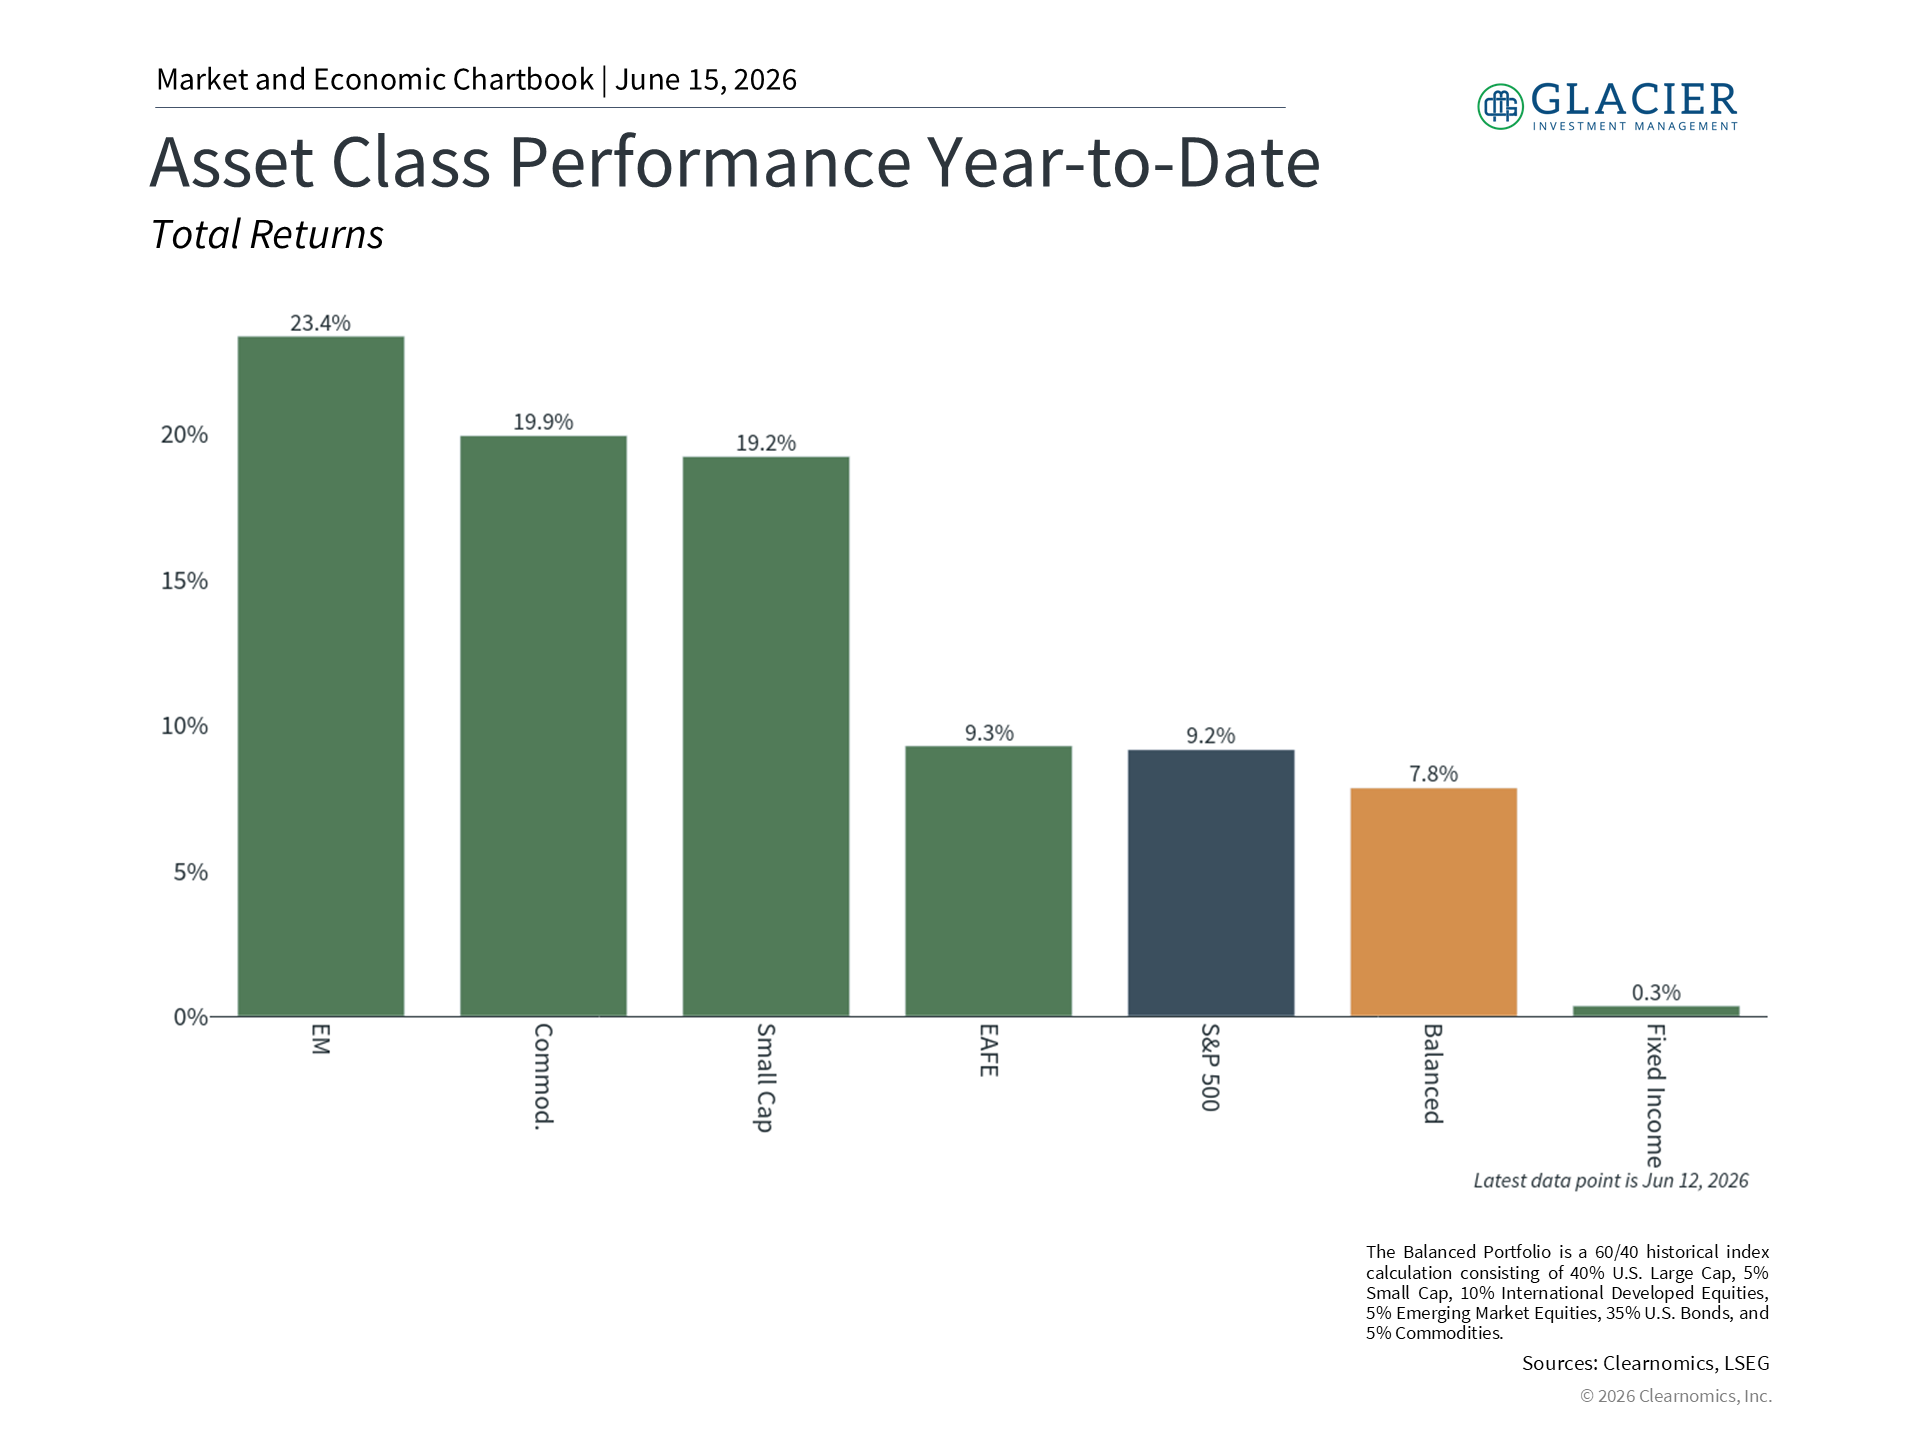
Beyond energy markets, many asset classes have been resilient this year. The U.S. stock market has experienced strong gains this year, with the S&P 500’s year-to-date return hovering around 10%, driven by strong earnings growth and a healthy economy.3 Bonds have also helped to stabilize portfolios during periods of volatility, even if the Bloomberg U.S. Aggregate Bond Index is essentially flat on the year.4 The 10-year Treasury yield is below 4.5% and the 30-year yield is under 5%, as both inflation and uncertainty have improved. International stocks have also performed well, continuing the trend of the past two years.5
Many sectors have contributed to these returns, with eight of the eleven S&P 500 sectors in positive territory. Not surprisingly, the energy sector has outperformed, gaining approximately 27% year to date as higher oil prices boosted revenues for producers. Other sectors with more defensive characteristics, including Utilities and Consumer Staples, also performed relatively well as investors sought stability. Information Technology has experienced volatility due to interest rate swings, but has experienced a return of about 17.5% year-to-date.
This is a reminder of why it’s important to maintain portfolio balance across different parts of the market. Geopolitics, inflation, and interest rates are difficult to predict, so holding different parts of the market that can support portfolios through these periods is the best way to manage risk while creating growth opportunities.
Investors should maintain a long view on geopolitics and economic cycles
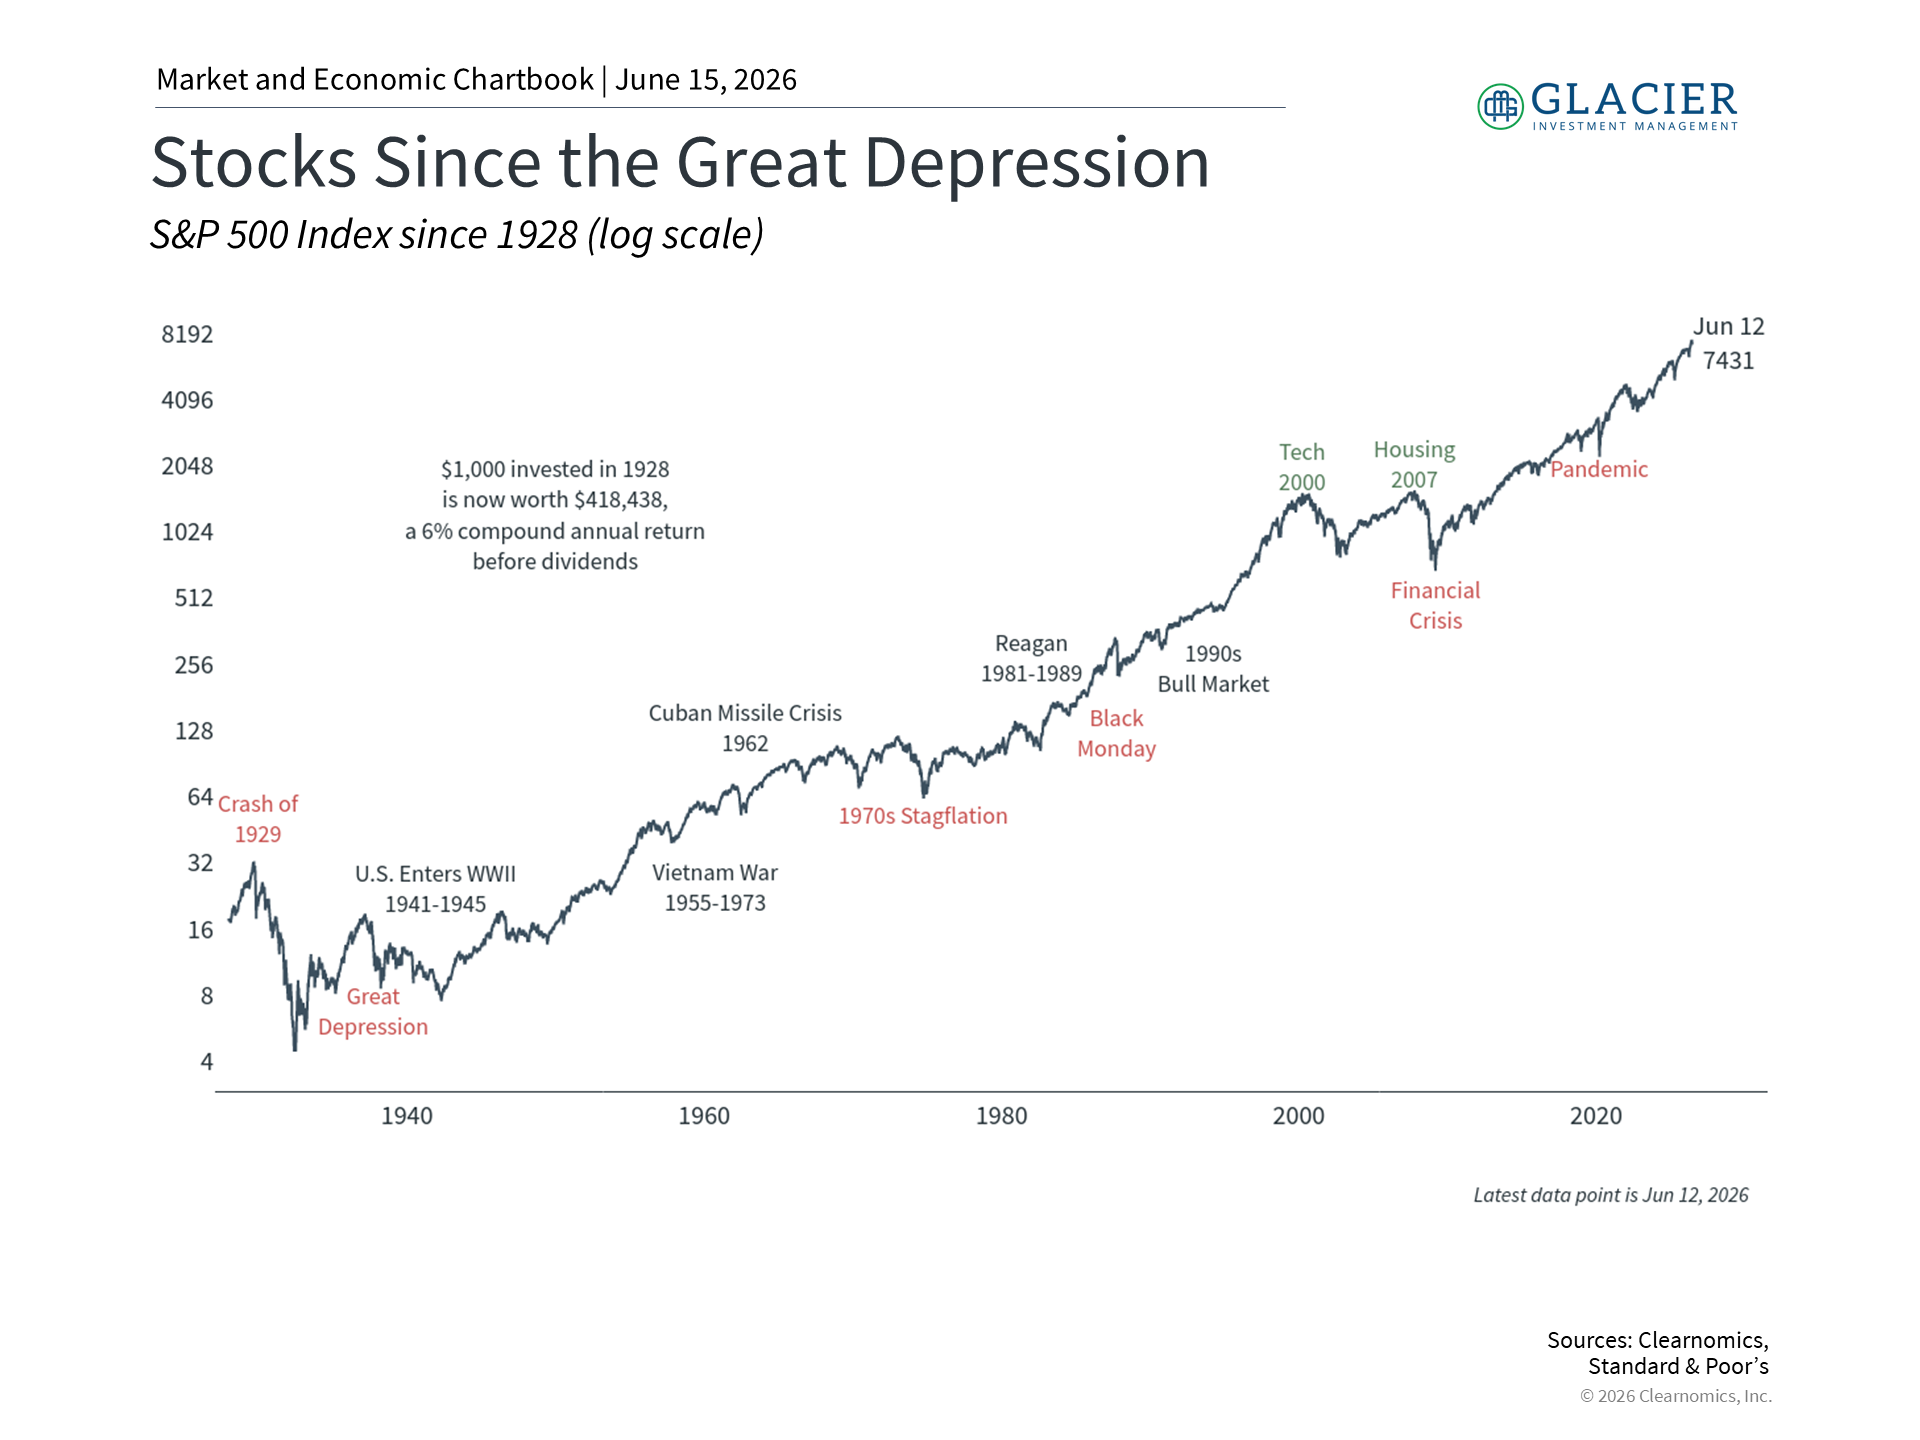
Over the past century, geopolitical conflicts, including wars, oil embargoes, and regional crises, have tested financial markets. While these events often led to short-term market swings, markets typically recovered and continued higher even when the underlying situations were not resolved. When zooming out, such as in the chart above, it’s easy to see that what drove long-term performance was not each event itself but the underlying economic and market cycles.
The announcement of a deal is undoubtedly positive. That said, it’s important to remember that well-constructed portfolios do not depend on this alone. Lower energy prices should reduce inflationary pressure, improve household purchasing power, and ease the burden of higher transportation costs on businesses, which all support the economy. It is also a timely lesson on the importance of staying invested and focusing on long-term outcomes in the pursuit of financial goals.
The Bottom Line
A preliminary U.S.-Iran peace agreement has lifted markets and pushed oil prices lower. For investors, history shows that the best way to navigate geopolitical events is to focus on long-term trends and financial goals.
References
1. Clearnomics research, CME Group data as of June 12, 2026
2. https://www.bls.gov/news.release/cpi.nr0.htm
3. Clearnomics research, Standard & Poor’s data through June 12, 2026
4. Clearnomics research, Bloomberg index data through June 12, 2026
5. Clearnomics research, MSCI index data through June 12, 2026
Index Descriptions
S&P 500
The Standard & Poor’s 500 Index is a capitalization-weighted index of 500 stocks designed to measure performance of the broad domestic economy through changes in the aggregate market value of 500 stocks representing all major industries.
MSCI Emerging Markets Index
The MSCI EM Index measures equity performance across emerging markets including Brazil, China, India, Korea, and others.
MSCI EAFE Index
The MSCI EAFE Index tracks developed markets outside the U.S. and Canada.
Bloomberg U.S. Aggregate Bond Index
This index tracks the U.S. investment‑grade fixed‑rate bond market.